AS-202 Multi Analyzer System
Speaker Test System [SA-242A. RME FIREFACE UC]
Output : 4Channel Speaker (CH/10W)
Input : 4Channel Unbalanced BNC-CCP Microphone, 4Channel Impedance (built-in)
Acoustic Sweep
Acoustic Sweep of the AS-202 Multi Analyzer System measurement software is optimized with the functions necessary for speaker unit measurement.
The 3D Analyzer System software includes all of the features of Acoustic Sweep and supports 3D graph measurement for speaker sound quality evaluation.
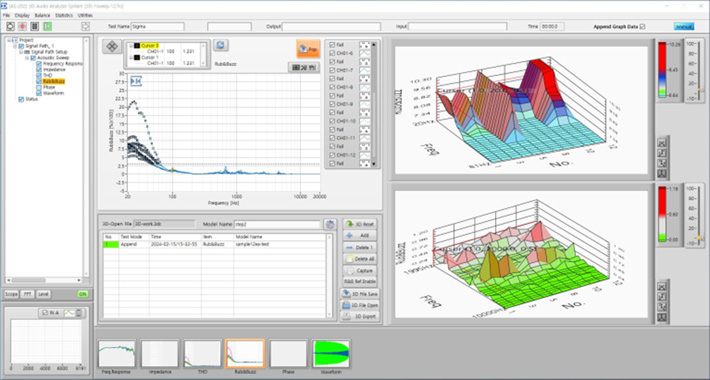
Sound quality evaluation using 3D graphs
Rub&Buzz data of measured products are displayed in a 3D graph.
The 3D graph is displayed in two set frequency sections, respectively.
The first frequency section is set to a low frequency band, and the second frequency section is set to a frequency band where subtle sound quality distortion occurs.
Identify products with low noise levels in the accumulated data of the first frequency range.
In the 3D graph, you can see that numbers 4 and 6 are lower than other products.
Among the products that were low in the first frequency range, identify the product that is lowest in the second frequency range.
Among products 4 and 6 identified in the first frequency section, you can see that number 6 is lower.
The confirmed product has the best sound quality among the products measured in the sound quality evaluation.
Evaluation of sound quality changes according to driving voltage
Sound quality is measured by gradually increasing the driving voltage applied to the product identified in the sound quality evaluation.
Through this test, you can check the effective driving voltage that can maintain stable sound quality.
As the driving voltage increases, the values of Rub&Buzz also change consistently.
However, as you go beyond the speaker's range of motion, the Rub&Buzz readings change dramatically.
Through this, you can check the maximum voltage that can be driven.
For low-quality products, you can see that the Rub&Buzz value increases when the driving voltage increases beyond a certain level.